File:20220726 Feedbacks affecting global warming and climate change - block diagram.svg

Size of this PNG preview of this SVG file: 800 × 587 pixels. Other resolution: 2,560 × 1,877 pixels.
Original file (SVG file, nominally 1,650 × 1,210 pixels, file size: 4 KB)
Summary
| Description |
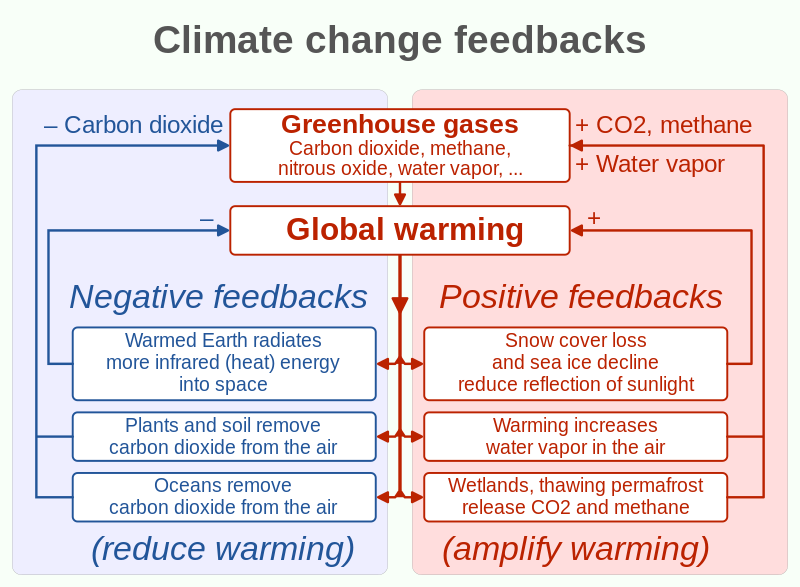
English: Block diagram showing feedbacks affecting global warming and climate change.
Example:
|
||
| Date | |||
| Source | Own work | ||
| Author | RCraig09 | ||
| Other versions |
|


Licensing
I, the copyright holder of this work, hereby publish it under the following license:
This file is licensed under the Creative Commons Attribution-Share Alike 4.0 International license.
- You are free:
- to share – to copy, distribute and transmit the work
- to remix – to adapt the work
- Under the following conditions:
- attribution – You must give appropriate credit, provide a link to the license, and indicate if changes were made. You may do so in any reasonable manner, but not in any way that suggests the licensor endorses you or your use.
- share alike – If you remix, transform, or build upon the material, you must distribute your contributions under the same or compatible license as the original.
File history
Click on a date/time to view the file as it appeared at that time.
| Date/Time | Thumbnail | Dimensions | User | Comment | |
|---|---|---|---|---|---|
| current | 04:14, 16 March 2024 | | 1,650 × 1,210 (4 KB) | commonswiki>RCraig09 | Version 11: changing "melting" to "thawing" |
File usage
The following file is a duplicate of this file (more details):
- File:20220726 Feedbacks affecting global warming and climate change - block diagram.svg from Wikimedia Commons
There are no pages that use this file.
